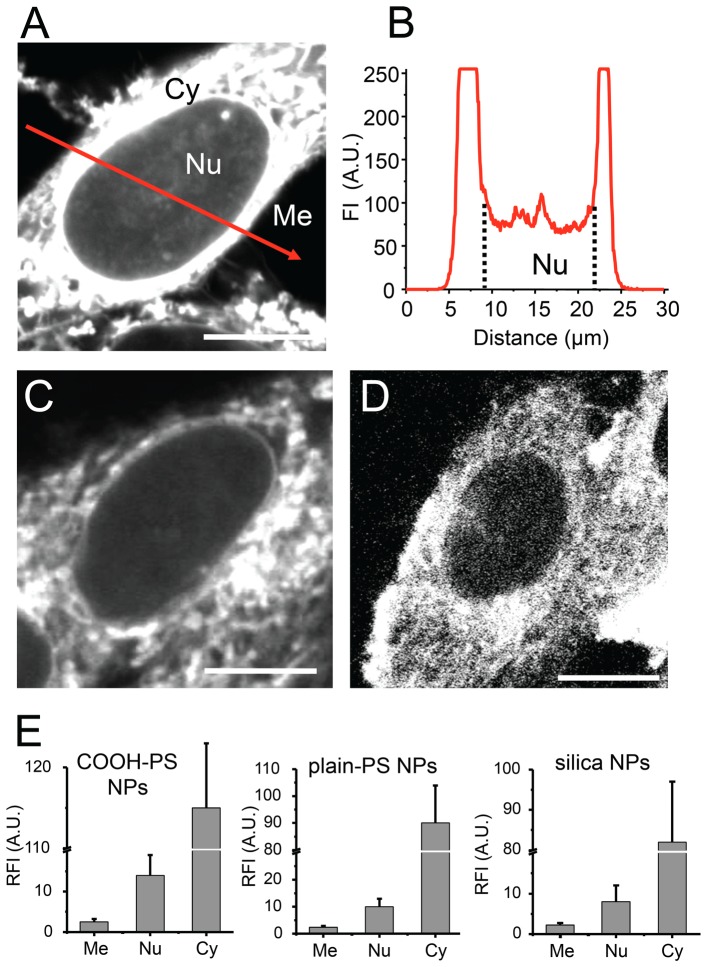
Figure 2. Cellular distribution of nanoparticles.
(A) Living HEp-2 cells were incubated with fluorescent (A) COOH-PS [YO] , (C) plain-PS YG or (D) silica NPs for one hour and analyzed by confocal microscopy. Representative micrographs show mid-nuclear confocal sections detecting NP fluorescence in the nucleus (Nu), the cytoplasm (Cy), and in the medium (Me). (B) Fluorescence intensity of COOH-PS [YO] NPs was recorded along the red line and displayed. Bars, 10 Çm. (E) Quantification of fluorescent NP-accumulation in the cytoplasm and the nucleus of living cells. HEp-2 cells were incubated with the indicated NPs for 1 hour. Mean fluorescence intensities were determined in circular regions (2 Çm in diameter) in the medium, nucleus or cytoplasm. Graphs show relative fluorescence intensities (RFI) mean values and standard deviations (n = cells each) normalized to the fluorescence intensity in the medium which was set to 2. A.U., arbitrary units.

