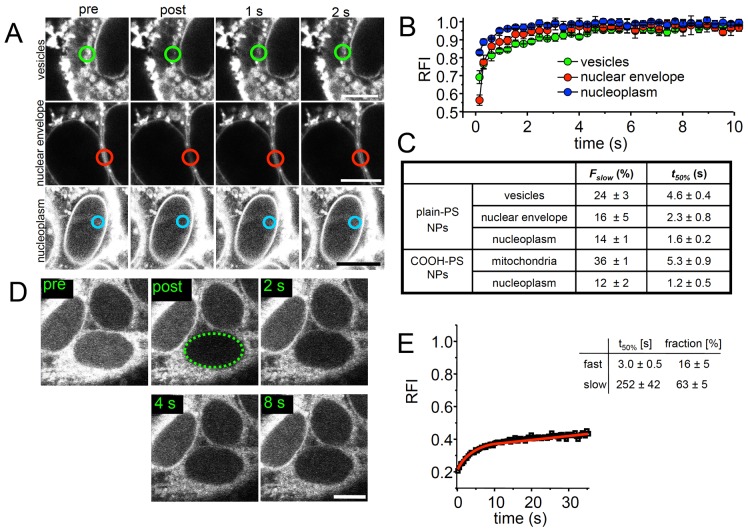
Figure 3. Quantitative analysis of PS NP dynamics in living cells by FRAP.
(A) HEp-2 cells were subjected to fluorescence recovery after photobleaching (FRAP) after incubation with fluorescent plain-PS [YG] NPs for 1 hour. Quantification was performed in circular regions containing cytoplasmic vesicles (green), at the nuclear envelope (red; micrograph of two adjacent cells), or in the nucleoplasm (blue). Note that FRAP analyses in the nucleus required increasing the detector gain of the confocal microscope due to the lower fluorescence signal in this compartment compared to the cytoplasm. Therefore the fluorescence signals in FRAP images appear over-saturated. Bars, 10 µm. (B) FRAP curves from independent experiments (n = 10) were then quantitated by plotting the relative fluorescence intensity (RFI) over time (graphs). Data were normalized to RFI = 1 within the bleached region before the bleach pulse. (C) The amount of slowly moving (interacting) NPs (F slow) and their recovery halftime (t 50%) at the indicated cellular structures were determined as described in Materials and Methods. (D) Whole nucleus FRAP. COOH-PS [YO] NP-fluorescence was bleached in a region containing the whole nucleus (dotted green line) and fluorescence recovery into the nucleus monitored over time. (E) Quantitation of whole nucleus FRAP experiments. Graph shows mean values from at least ten measurements (standard deviations were below 16% of mean values, not shown). (E) FRAP data were fitted to a two-component exponential function (red graph) from which the recovery halftimes and the relative fractions of fast and slowly exchanging COOH-PS [YO] NP populations were determined. Bars, 10 µm.

