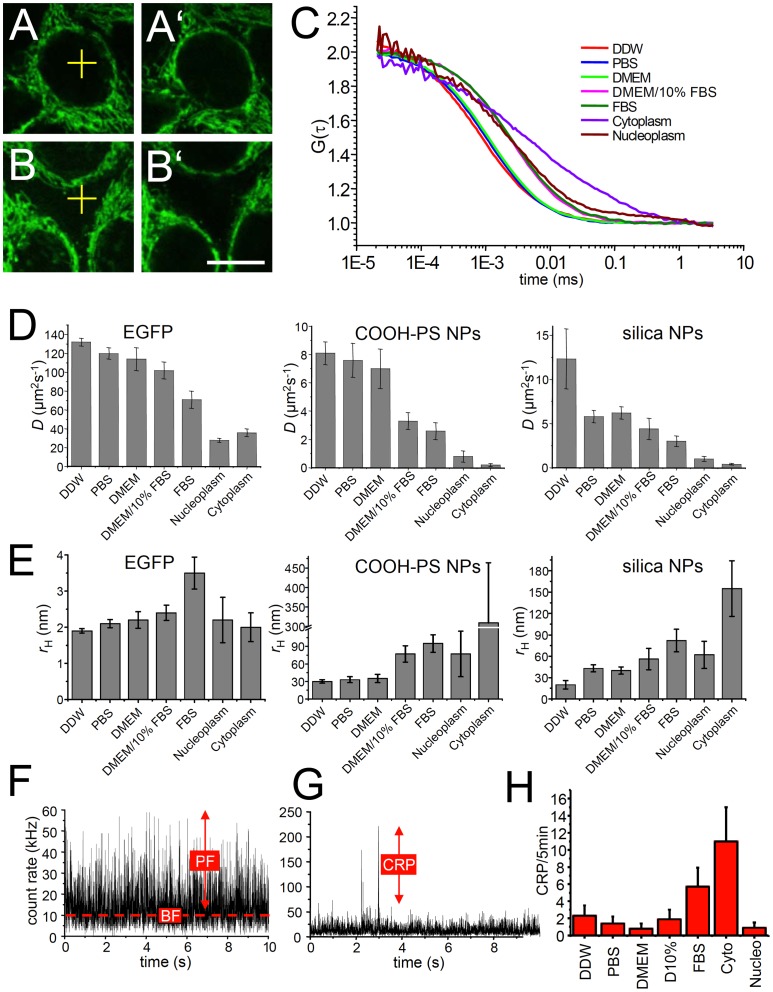
Figure 4. Diffusion behavior of nanoparticles in living cells and in vitro.
(A–B') Sample micrographs: HEp-2 cells were incubated with fluorescent COOH-PS [YO] NPs for 30 min and FCS measurements were performed in the nucleus (A, yellow cross) or at cytoplasmic locations outside the strongly labelled regions (B, yellow cross). Bar, 10 µm. A‘ and B‘ show the same subcellular locations after the FCS measurement. (C) Autocorrelation curves from FCS measurements at room temperature in distilled water (DDW), phosphate-buffered saline (PBS), Dulbecco‘s modified Eagle‘s medium (DMEM), in DMEM containing 10% fetal calf serum (DMEM/10% FBS), in undiluted FBS, as well as in the nucleoplasm and cytoplasm of living HEp-2 cells. (D) The diffusion coefficients of EGFP, COOH-PS [YO] NPs and silica NPs in different solvents or compartments of living cells were determined by FCS measurements. (E) The hydrodynamic radii of EGFP, COOH-PS [YO] NPs and silica NPs were determined in different solvents or compartments of living cells from the respective diffusion coefficients obtained by FCS. (F) Representative count rate trace of an FCS measurement of COOH-PS [YO] NPs in the nucleus. BF, background fluorescence; kHz, kilo Hertz; PF, particle fluorescence. (G) Representative count rate trace of an FCS measurement of COOH-PS [YO] NPs in the cytoplasm. CRP, count rate peaks. (H) The number of CRPs during 5 minutes FCS measurements was quantified from count rate traces within the indicated solvents or cellular compartments. Cyto, cytoplasm; D, diffusion coefficient; NPs, nanoparticles; nucleo, nucleoplasm.

