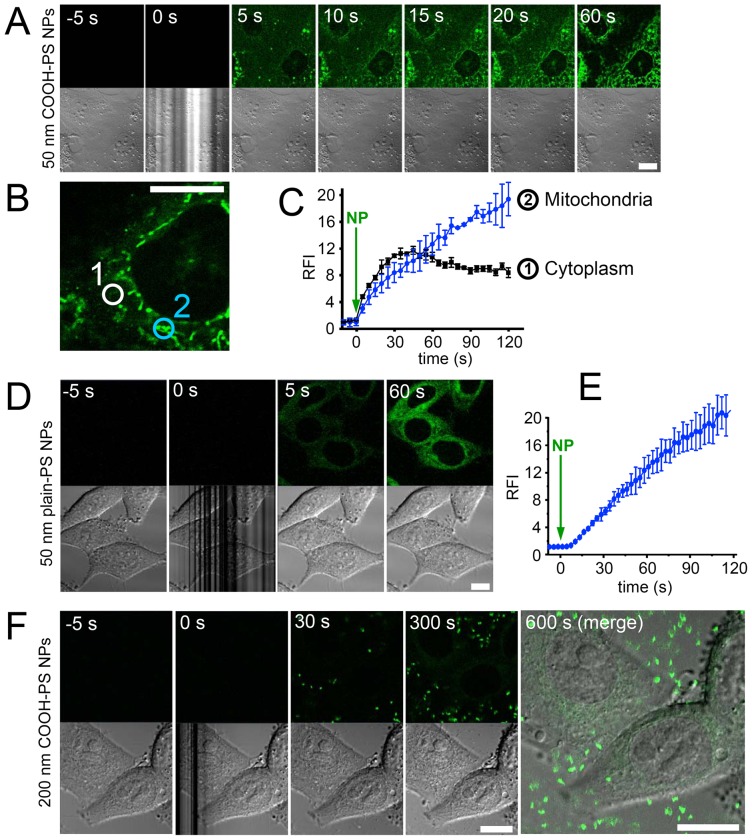
Figure 6. Rapid uptake of polystyrene nanoparticles in living cells.
(A) Living HEp-2 cells were imaged to visualize particle fluorescence by confocal microscopy (upper panel) and differential interference contrast (DIC, lower panel). Fluorescent COOH-PS [YO] NPs were added directly to the culture medium at time point 0 seconds (0 s). Note, that the application of NPs is visualized by the distorted DIC image. (B) Circular regions of interest within the diffuse cytoplasmic pattern (1) or at mitochondria (2) were selected to measure the accumulation of fluorescent particles over time at different intracellular locations. (C) Quantification of measurements as described in (B) for COOH-PS [YO] NP fluorescence accumulation in the diffuse cytoplasm (black graph) and at mitochondria (blue graph). (D) Same experiment as in (A), using fluorescently labelled plain-PS [YG] NPs. (E) Quantification of measurements as described in (D) for plain-PS [YG] NP fluorescence accumulation in the cytoplasm. Relative fluorescence intensity (RFI) in C and E was normalized to 1 at 0 seconds. (F) Same experiment as in (A), using bulk sized (200 nm diameter) fluorescently labelled COOH-PS [YG] particles. Bars, 10 µm. NP, addition of nanoparticles; RFI, relative fluorescence intensity; s, seconds.

