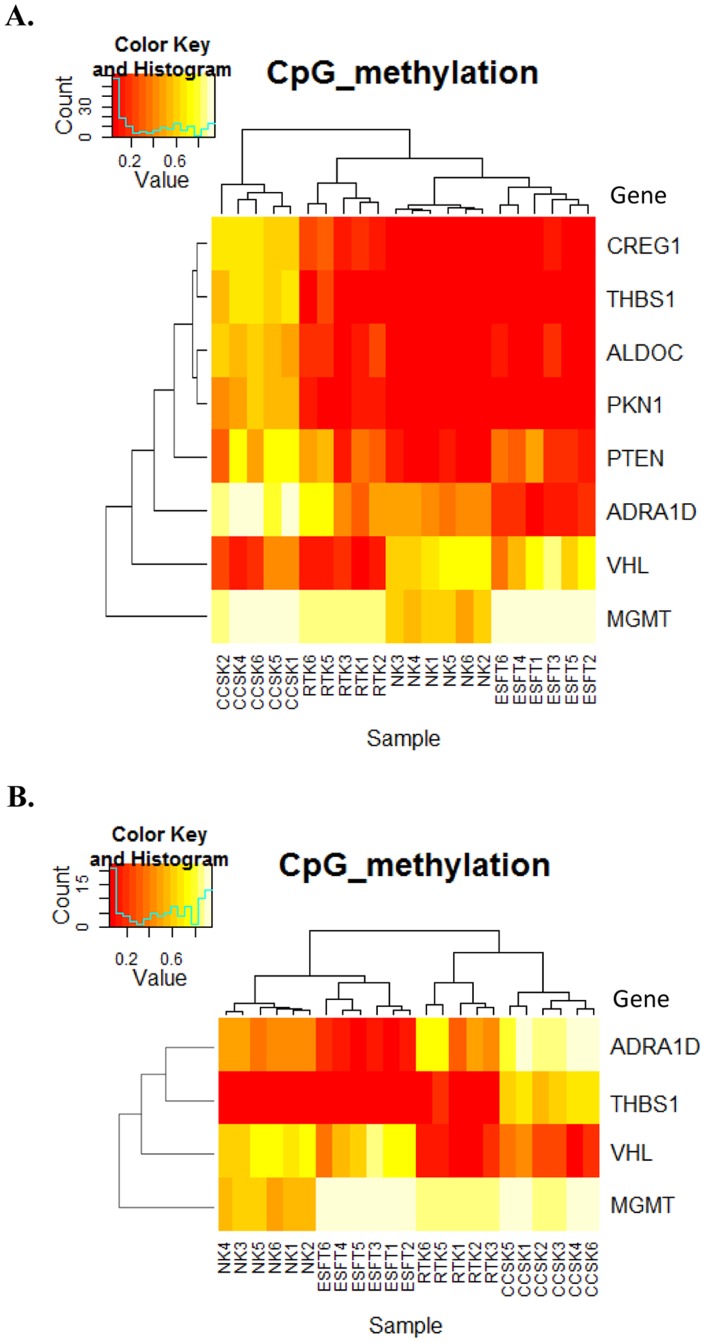
Figure 2. Hierarchical cluster analysis of methylation level of CpG analyzed by MassARRAY.
(A) Based on the results indicated in Figure 1, 8 genes were selected as described in the text and analyzed by MassARRAY. Two-way hierarchical cluster analysis was performed using the CpG methylation average of all CpG that have passed QC from each gene. Two cases (RTK4 and CCSK3) showed failed analysis of some CpG sites, and were excluded from hierarchical analysis. (B) Four genes were further selected, and cluster analysis using the methylation average was performed as in (A). CCSK3 was successfully analyzed in all four genes, and included in this analysis.

