
Figure 3.
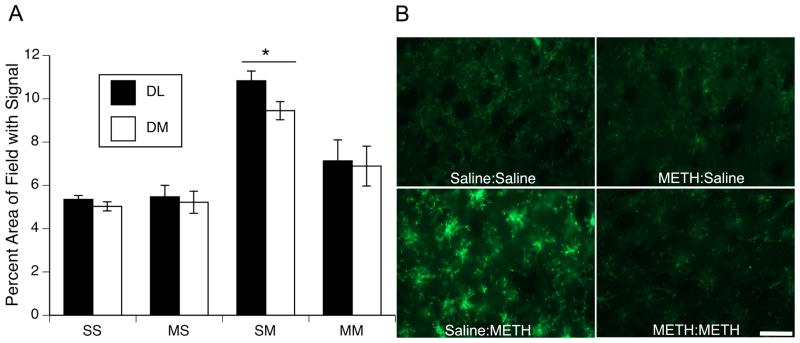
(A) Quantitative analysis of the effects of single or repeated METH exposure on CD11b expression in striata of animals sacrificed 48hr after the last injection on PND90. Data are mean percent area of the total image field with CD11b signal above threshold (± SEM, n=5–8) in dorsolateral (DL; black bars) and dorsomedial (DM; white bars) striatum. Treatment group designations indicate PND60 treatment:PND90 treatment, resulting in the four treatment groups: Saline:Saline (SS); METH:Saline (MS); Saline:METH (SM); and METH:METH (MM). * SM group significantly different from all other groups, p<0.05. (B) Representative images of CD11b immunohistochemical staining 48 hr after the last injection on PND90. Scale bar= 50μm.