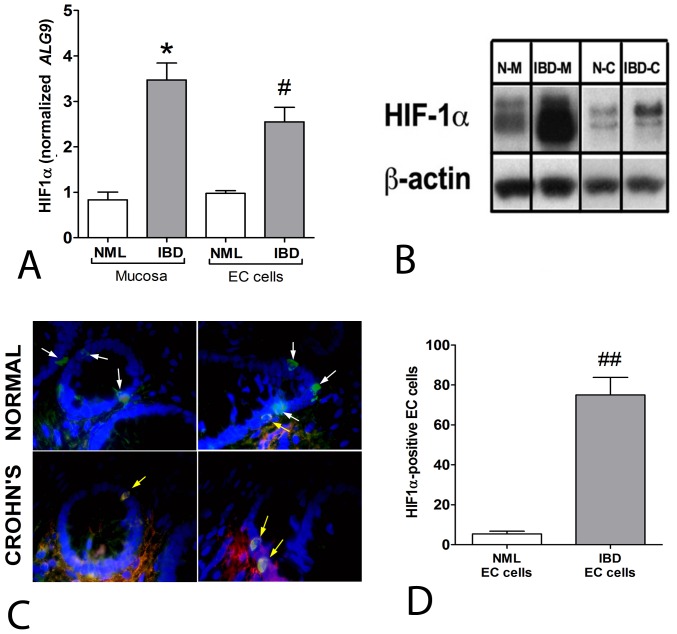
Figure 1. HIF-1α transcripts and protein in normal mucosa, IBD mucosa, isolated normal and IBD-EC cells.
1A) Transcript of HIF-1α was significantly elevated in IBD-associated conditions (mucosa: 3.4±0.63 fold, cells: 2.4±0.41). 1B) Protein levels were significantly elevated in IBD-associated conditions (mucosa: 12.2±3.4, cells: 2.6±0.36). 1C) Immunohistochemical staining of HIF-1α and Chromogranin A (white arrows) in normal mucosa and Crohn’s mucosa identified co-staining (yellow arrows) predominantly in IBD mucosa. 1D) Quantitation identified significantly more enteroendocrine cells to be HIF-1α positive in IBD mucosa. Mean±SEM, n = 4–7, *p = 0.03 vs. normal mucosa, # p = 0.04 vs. normal EC cells, ## p<0.001 vs. normal EC cells. DAPI – nuclei (blue), FITC-CgA (green), Cy5-HIF-1α (red), co-localization (yellow). N–M = normal mucosa, IBD-M = IBD mucosa, N–C = normal EC cells, IBD-C = IBD EC cells.

