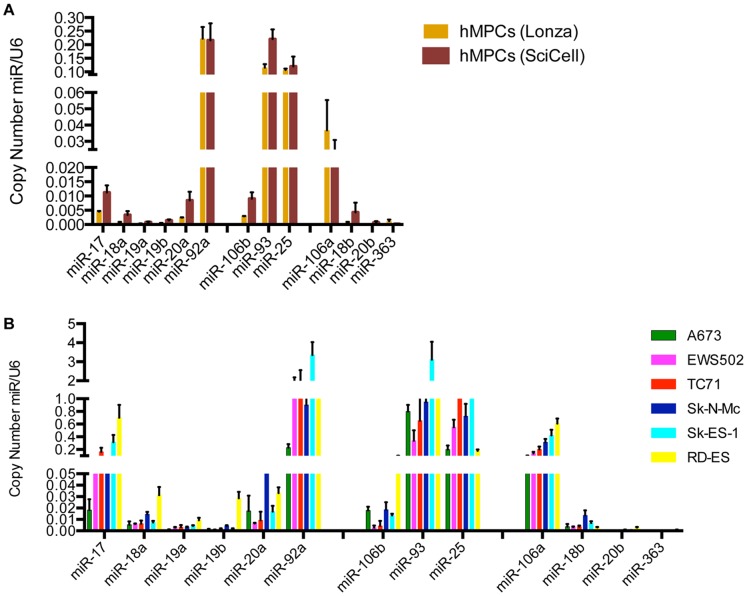
Figure 2. Relative levels of miR-17∼92a, miR-106b∼25, and miR-106a∼363 cluster components in EWS cells and hMPCs.
Relative levels of the individual miRs within a given cluster in each cell line were determined by qRT-PCR using a best-fit linear equation generated by the amplicon standard curve in order to account for differences in primer efficiency. [57] Values represent the mean and standard deviation of biological triplicates.

