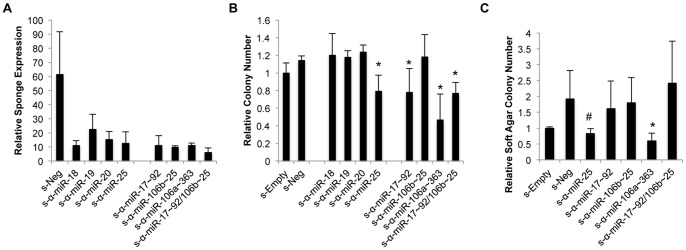
Figure 4. Effects of miR-blocking sponge expression on Ewing Sarcoma cell growth.

(A) Sponge expression levels in Sk-ES-1 cells as determined by qRT-PCR. Results represent the mean and SEM of three independent experiments, each performed in triplicate. (B) Colony formation by Sk-ES-1 cells stably transduced with the indicated miR-blocking sponge constructs, in a clonogenic assay. Data represent the mean and SEM of two independent experiments, each performed in triplicate. *p<0.05 compared to s-Empty and s-Neg, individually. (C) Colony formation by Sk-ES-1 cells stably transduced with the indicated miR-blocking sponge constructs, in a soft agar assay. Results represent the mean and SEM of three independent experiments, each performed in triplicate. *p<0.05 compared to s-Empty and s-Neg, individually; #p<0.05 compared to s-Empty only based on an unpaired student’s t-test.
