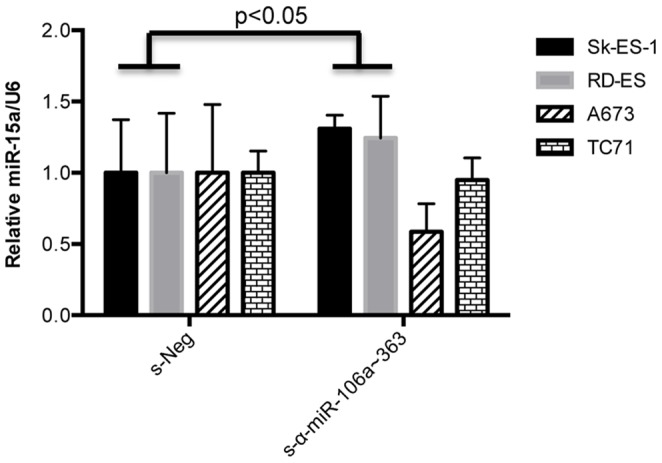
Figure 6. Effects of s-α-miR-106a∼363 expression on miR-15a levels in Ewing Sarcoma cell lines.

Levels of miR-15a in the indicated Ewing Sarcoma cell lines stably expressing s-Neg or s-α-miR-106a∼363, as determined by qRT-PCR. Results represent the mean and SEM of a minimum of four independent experiments, each performed in triplicate.
