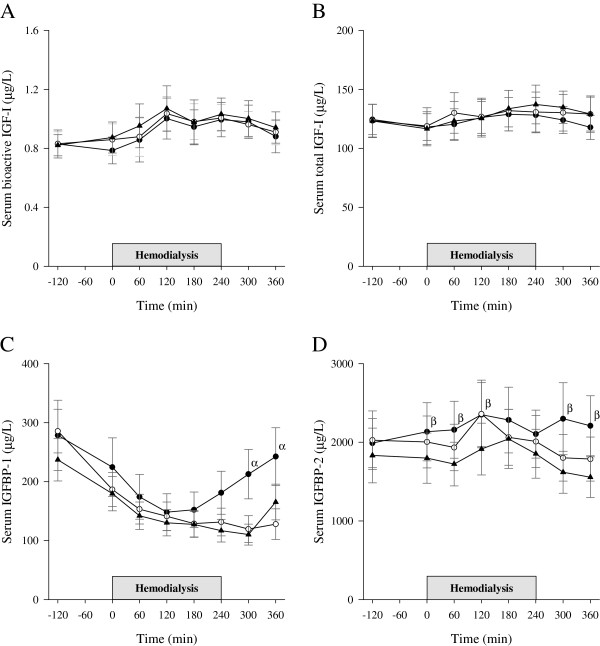
Figure 3.
Serum bioactive IGF-I, total IGF-I, IGFBP-1, and IGFBP-2. Bioactive IGF-I (A), total IGF-I (B), IGFBP-1 (C), and IGFBP-2 (D) changes during the experiments on no treatment (black circles), glucose infusion (open circles), and glucose-insulin infusion (black triangles) study days. αp < 0.003 for NT vs G and βp < 0.02 for NT vs GI study days. Data are expressed as mean ± SEM.

