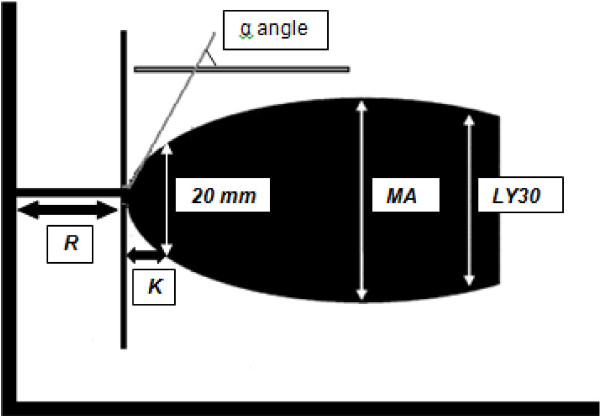
Figure 2.
A representative signature waveform of a normal TEG® tracing. R(seconds) = time of latency from start of test to initial fibrin formation; K (seconds) = time taken to achieve a certain level of clot strength (amplitude of 20mm); α angle (degrees) = measures the speed at which fibrin build up and cross linking takes place, hence assesses the rate of clot formation; MA (millimeters) = represents the ultimate strength of the fibrin clot; LY30 (%) = percentage decrease in amplitude at 30 minutes post-MA and gives measure of degree of fibrinolysis.

