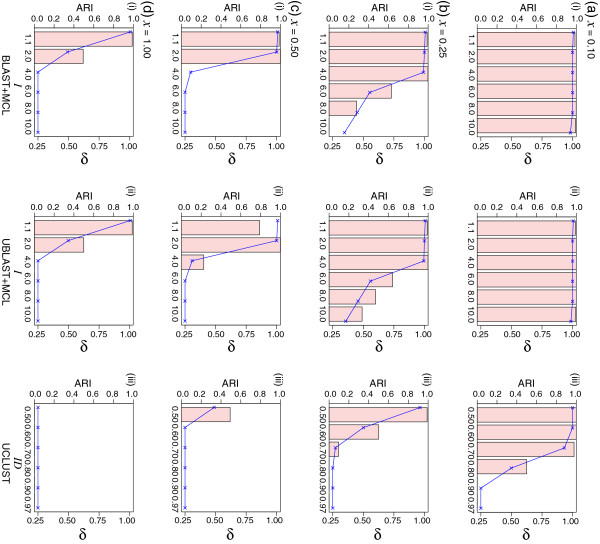
Figure 3.
The effect of sequence divergence on clustering accuracy. In each panel, the bar chart shows the ARI values (Y-axis on the left) observed from clustering of the data simulated at various branch length (x) of tree topology shown in Figure 2, with x set at (a) 0.10, (b) 0.25, (c) 0.50, and (d) 1.00 substitutions per site, using (i) BLAST+MCL, (ii) UBLAST+MCL, and (iii) UCLUST, across the specific parameter settings (X-axis on each panel: I for MCL, ID for UCLUST). All numbers shown are averaged across five replicates in each instance. Standard deviation from the mean in each case (not shown) is < 0.02. The δ values are plotted within the same panel (Y-axis on the right). See also Additional file 1: Figure S4.

