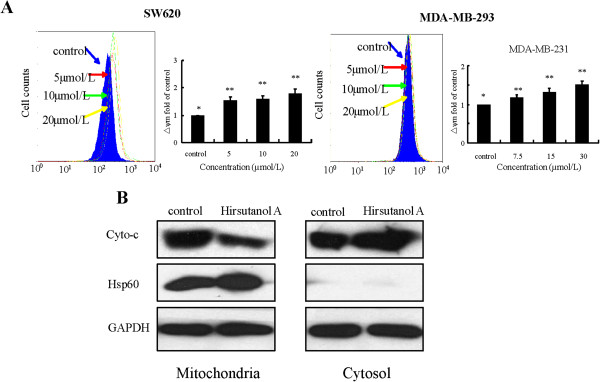
Figure 5.
Hirsutanol A activated mitochondria/cytochrome c signaling pathway. Cells were exposed to various concentrations of hirsutanol A for 3h. The △ψm was determined by flow cytometry. Results are presented as means ± SD from 3 independent experiments. (** < 0.01 versus *) (A). Cells were first treated with 20μmol/L hirsutanol A for 24h. Proteins obtained from cytosolic and mitochondria fractions were detected by immunoblotting assay (B).

