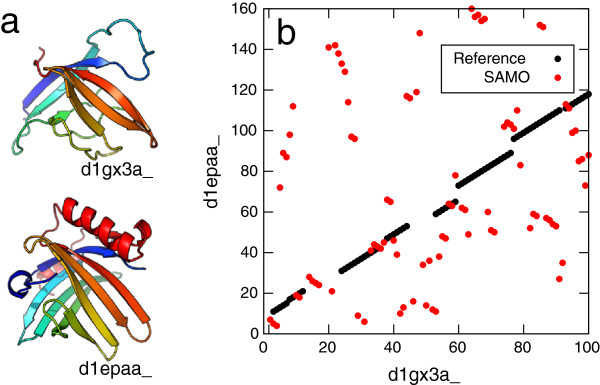
Figure 1.

The illustrative example of ‘over-fragmentation’ in alignment. The comparison of a manually curated structure alignment with an automatically generated alignment by a non-sequential structure alignment program, SAMO. (a) The structures of arylamine N-acetyltransferase (SCOP-ID d1gx3a_, shown on upper part) and epididymal retinoic acid-binding protein (SCOP-ID d1epaa_, shown on lower part). This pair is taken from MALISAM database. (b) displays the alignment plot of the pair. Black points indicate the reference alignment and red indicate alignment by SAMO. The reference alignment shows RMSD of 4.4 Å over 77 residues, while the alignment by SAMO gives 3.4 Å over 91 residues.
