Figure 10.
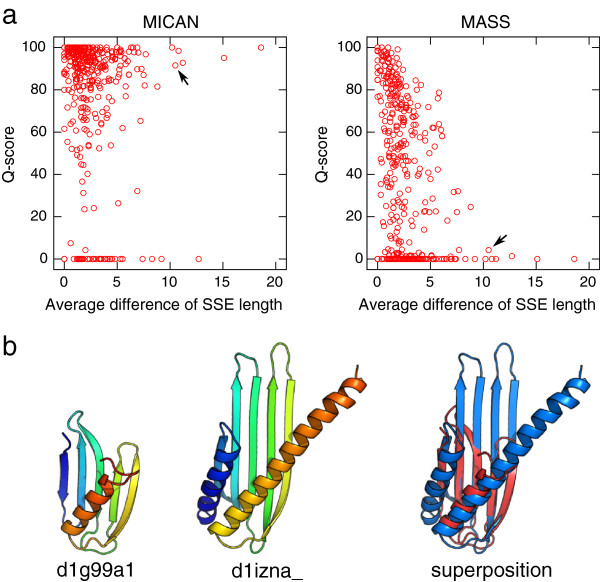
The dependency between differences of aligned SSE length and alignment accuracy. (a) Relationship between average differences of aligned SSE length and the Q-scores obtained by MICAN(left) and MASS(right). Average differences of aligned SSE length is calculated based on the reference alignment. All the targets in both MALIDUP-sq and MALISAM-sq are plotted as red circles. Black arrows indicate the protein pairs shown in (b). (b) An example of a protein pair that shows large difference of aligned SSE length. The left two cartoon structures are the target proteins, which is taken from MALISAM-sq test set. The right one is superimposition according to the reference alignment. Average difference of aligned SSE length of this pair is 11. While MASS almost failed to reproduce the reference alignment of this pair, MICAN successfully reproduced it.

