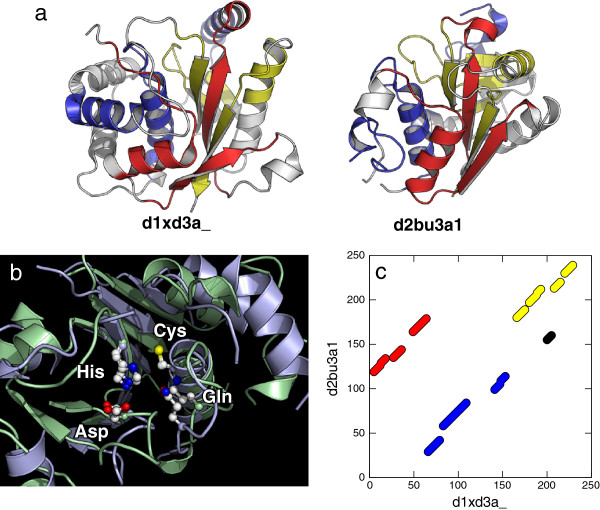
Figure 11.
Comparison of UCH-L3 and Phytochelatin synthase. (a) The cartoon models of UCH-L3 (d1xd3a_) and Phytochelatin synthase (d2bu3a1). The aligned regions are shown in three colors red, blue and yellow corresponding to the colors used in (c). (b) A close view of the catalytic-site of the superimposed structure by MICAN. The aligned regions of UCH-L3 and Phytochelatin are shown as cartoon models in light blue and light green, respectively. The ball-and-stick representation indicate sidechain atoms of catalytic-site residues His, Asp, Cys and Gln. White, blue, red and yellow balls correspond to carbon, nitrogen, oxygen and sulfur atoms. (c) The structural alignment of the two proteins generated by MICAN.

