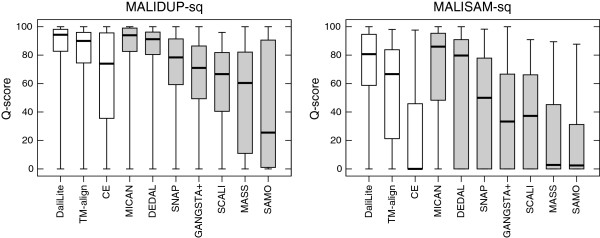
Figure 2.

The results of reference-dependent assessment with sequential test sets. The box-and-whisker plot of the distribution of the Q-score obtained for three sequential (white boxes) and seven non-sequential methods (gray boxes). The left (right) plot represents the result for the test with MALIDUP-sq (MALISAM-sq) set.
