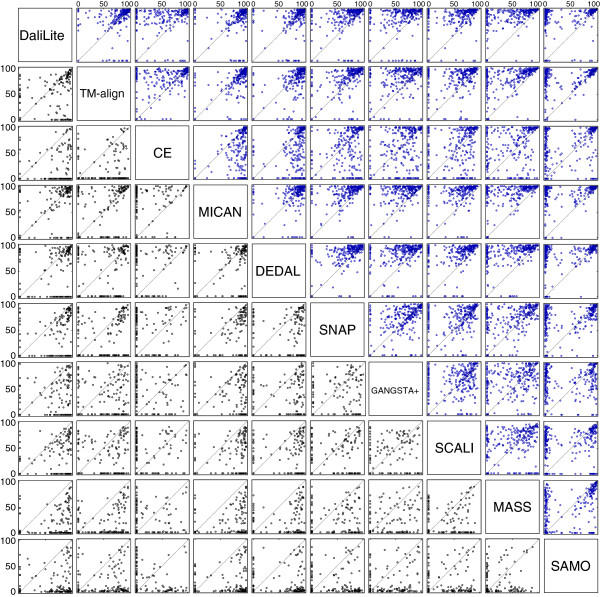
Figure 3.
The scatter plots of Q-score for all pairs of the compared methods for the sequential test sets. Comparison of the Q-score for all pairs of the compared methods for the sequential test sets. Upper right diagonal shows the scatter plots of MALIDUP-sq set. Lower left shows those of MALISAM-sq set.

