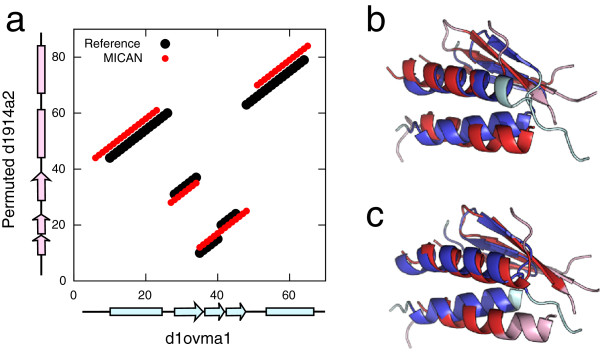
Figure 7.

The example of failed alignment of MICAN. (a) Comparison with the reference alignment (black) and MICAN (red). This protein pair (d1ovma1 and permuted d1914a2) was taken from MALISAM-ns. The horizontal axis and the vertical axis correspond to residue positions of d1ovma1 and those of permuted d1914a2, respectively. Positions of α -helices and β -strands in the native structure are also indicated by cyan and pink bars. (b) The superimposition according to the reference alignment. The structure of d1ovma1 is colored in blue and cyan, and that of permuted d1914a2 is colored in red and pink. Blue and red regions indicate aligned residues, and cyan and pink represent unaligned residues. (c) The superimposition based on the alignment by MICAN.
