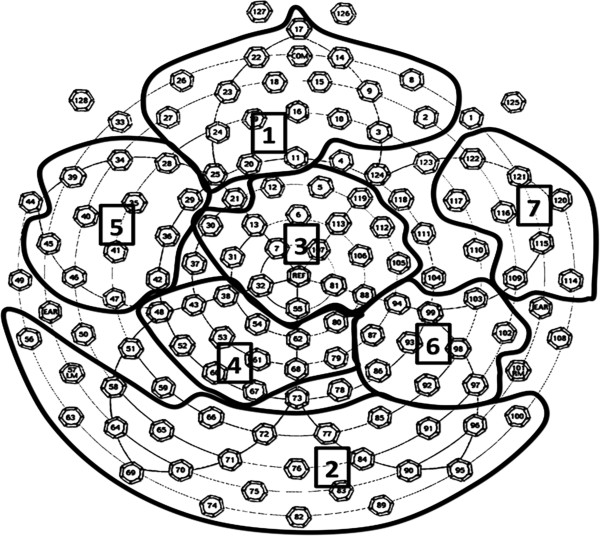
Figure 1.
Electrode map, clusters and corresponding peaks of interest used in the analysis. 1, frontal cluster (P3); 2, occipito-temporal (N170); 3, central (P3); 4, parietal (P3/late positive potential (LPP)); 5, left fronto-temporal (LPP); 6, right parieto-temporal (LPP); 7, right fronto-temporal (LPP).

