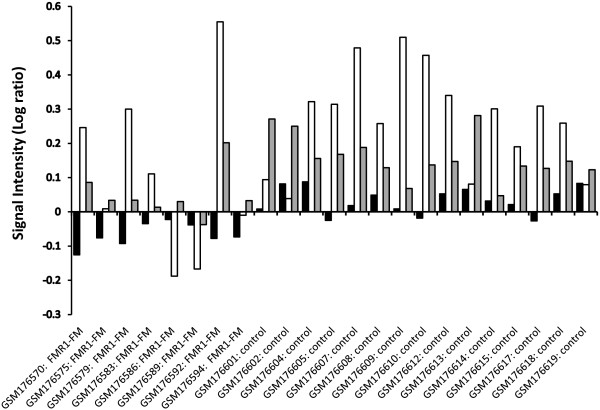
Figure 2.
Signal intensity Log ratios. Differential expression of Rad9A (black bars), ATM (white bars), and OGG1 (gray bars) in cell lines containing FMR1 full mutation (FM) and controls. Rad9A and OGG1 showed decreased expression of transcript in FMR1-FM cell lines compared to controls. In a few FMR1-FM cell lines we observed a significant decrease in ATM (GSM176575, GSM176586, and GSM176589); however, the expression of ATM was not significantly different from FMR1-FM and controls.

