
Figure 1.
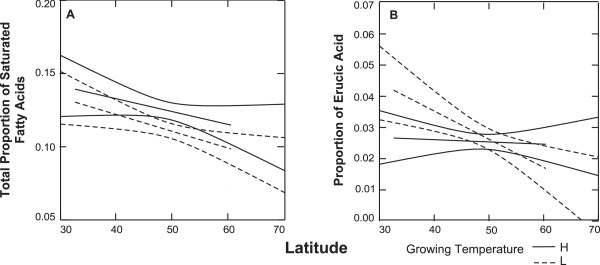
Regressions of proportions of FAs in TAGs on latitude at high and low temperature treatments. Only FAs that had a significant cline for at least one growing temperature are presented. High growing temperature regressions are solid lines and low growing temperature regressions are dotted lines. 95% confidence intervals are shown. (A) Total saturated FAs (16:0 + 18:0 + 20:0) in TAGs; (B) Relative proportion of 22:1in TAGs.