
Figure 3.
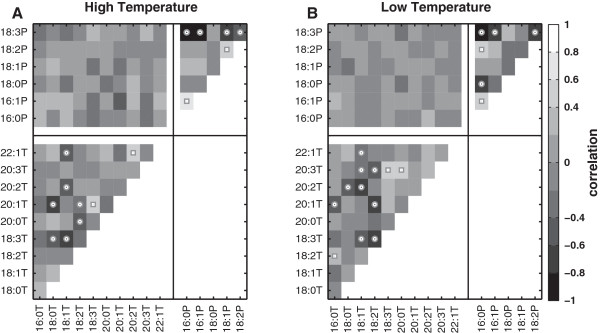
Correlations among FAs between and within TAGs and PLs. ‘T’ and ‘P’ indicates FAs present in TAGs and PLs, respectively. Circles and squares in the cells indicate significant negative and positive correlations, respectively, at BH-FDR and q-value =0.05. The numerical bins for the correlations corresponding to the shading are shown in the bar to the right. (A) Correlations among FAs in TAGs and PLs for plants grown at high temperature. (B) Correlations among FAs in TAGs and PLs for plants grown at low temperature.