
Figure 2.
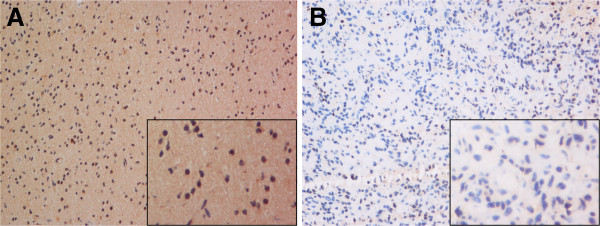
IHC images of 2 distinct patients. A (LGG patient), showed high expression of BMP4 in cytoplasm; B (HGG patient), showed low expression of BMP4. Magnification: larger images, ×200; smaller images, ×400.
Official websites use .gov
A
.gov website belongs to an official
government organization in the United States.
Secure .gov websites use HTTPS
A lock (
) or https:// means you've safely
connected to the .gov website. Share sensitive
information only on official, secure websites.
IHC images of 2 distinct patients. A (LGG patient), showed high expression of BMP4 in cytoplasm; B (HGG patient), showed low expression of BMP4. Magnification: larger images, ×200; smaller images, ×400.