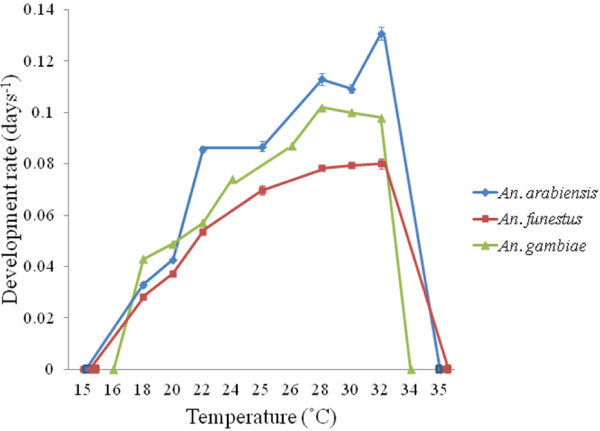
Figure 1.
Mean development rate and constant temperature. Mean development rate (days-1) per constant temperature (ranging from 15°C to 35°C) for Anopheles arabiensis (blue ♦), An. funestus (red ■) and An. gambiae (green ▲) (data for An. gambiae obtained from [7]). Lines linking data points are not fitted and are for reference only. 95% confidence intervals are shown for An. arabiensis and An. funestus, but are typically obscured by the data points. For the full range of temperatures, the development rate of each species is typically non-linear. For each species, there exists a linear part to this curve, which differs between species.

