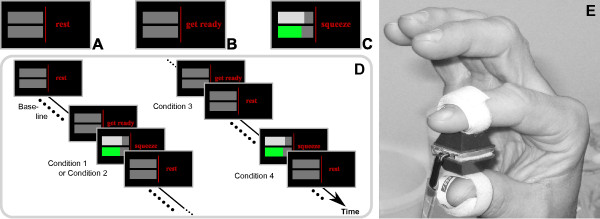
Figure 1.

Illustration of the task and the experimental protocol.A: visual stimulus during the rest periods. B: visual cue. C: visual stimulus during the isometric pinching periods. Upper bar (white): desired force. Lower bar (green): achieved force. D: Schematic representation of the experimental protocol. Each recording session started (ended) with 180 (120) seconds of baseline, followed by random presentation of the four different conditions. Conditions were separated in time by rest periods of randomized durations (from 15 to 24 seconds). E: force sensor attached between the tips of the right index finger and thumb. A-D: Ⓒ2011 IEEE. Reprinted, with permission, from [34].
