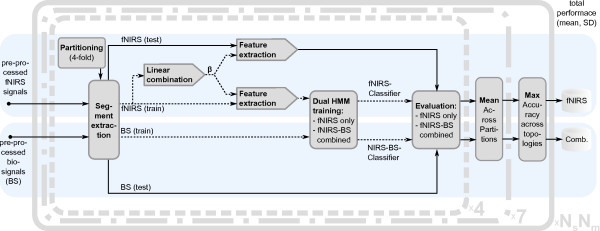
Figure 5.

Overview of the signal flow in the data classification. Data segments were extracted from pre-processed fNIRS data and biosignals. Training data are indicated with dashed arrows, and test data are displayed with solid arrows. fNIRS training segments were used to extract feature signals based on linear combinations of all signals from one location, and observations were formed based thereon (block “Feature extraction”). Biosignal observations were directly formed from segments of the pre-processed biosignals. The training observations were used to train two dual HMMs either with fNIRS data only or with the combined (fNIRS and biosignals) observation. The trained classifiers were evaluated based on the test observations. The classification results of four different partitions (dashed bounding box) were averaged to yield the mean performance of a complete cross-validation run. This was repeated a total of seven times (dash-dotted bounding box) to yield the mean classification performance for a given model topology. Ten different model topologies were investigated (solid bounding box) and the one with highest performance was selected.
