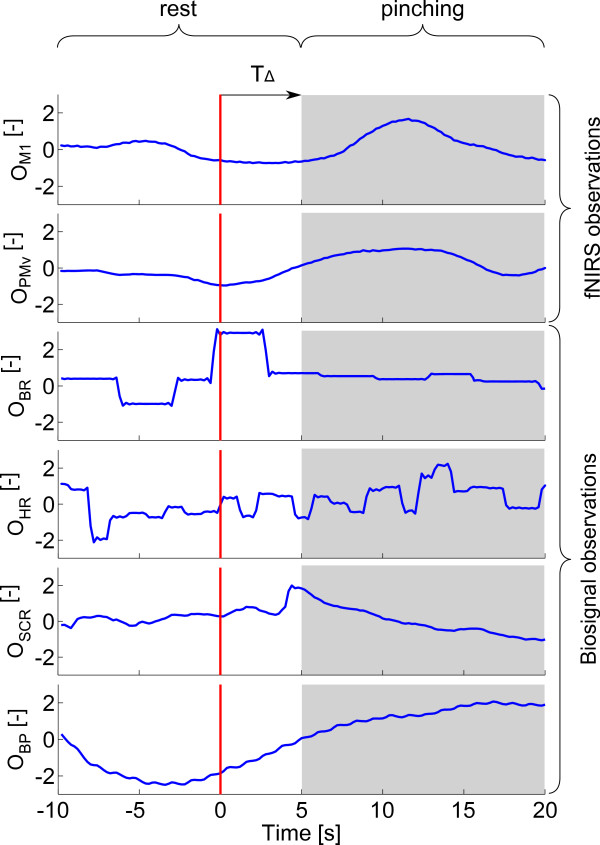
Figure 6.
Representative observation signals. A rest (white background) and a pinching (gray background) test trial are shown. The red vertical line at t=0 represents the stimulus onset when the subject started pinching isometrically, TΔ is the shift of 5 seconds that was applied for the extraction of observations. OM1, OPMv : fNIRS observations of data from M1 and PMv, respectively. OBR, OHR : observations of breathing and heart rate, respectively. OSCR : observation of skin conductance response. OBP : observation of blood pressure signal. Note that all observations are unit-less due to the normalization steps in the pre-processing.

