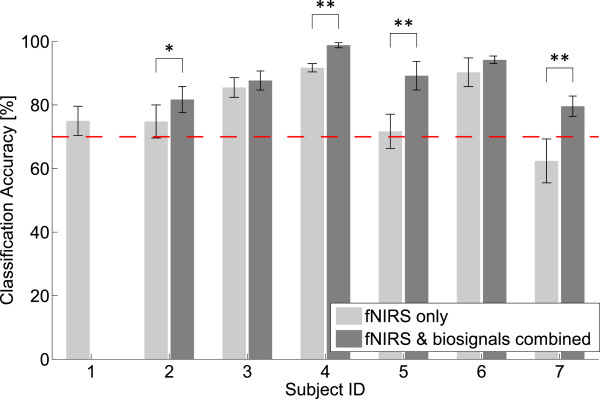
Figure 7.

Classification accuracies of the two different classifiers. Shown are the classification accuracies (mean ± SD) for fNIRS only (light gray) and the fNIRS-biosignal combination (dark gray) for subjects 1 to 7. The number of states and mixtures were individually chosen to maximize the accuracy. The dashed line indicates 70% accuracy, which was identified as the lower bound for useful BCI operation. ∗ : p < 0.05, ∗∗ : p < 0.01 (paired t-test across 7 complete cross-validation runs).
