
Figure 2.
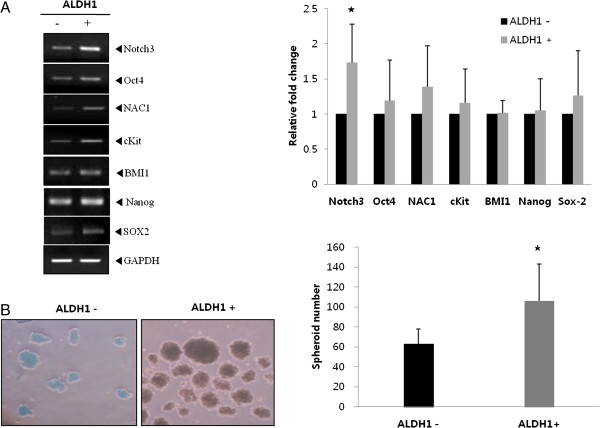
ALDH1(+) cells show stem cell properties. A. mRNA expression of stemness-associated genes, particularly Notch 3, increased in ALDH1(+) cells compared with that in ALDH1(−) cells. The graph represents the relative fold expression of band density normalized to that of GAPDH (*p < 0.05). B. The spheroid formation assay revealed an increased number of spheroids in ALDH1(+) cells. The graph presents the average spheroid formation in ALDH1(+) and ALDH1(−) cells (*p < 0.05). All data are representative of at least two independent experiments.