Figure 1.

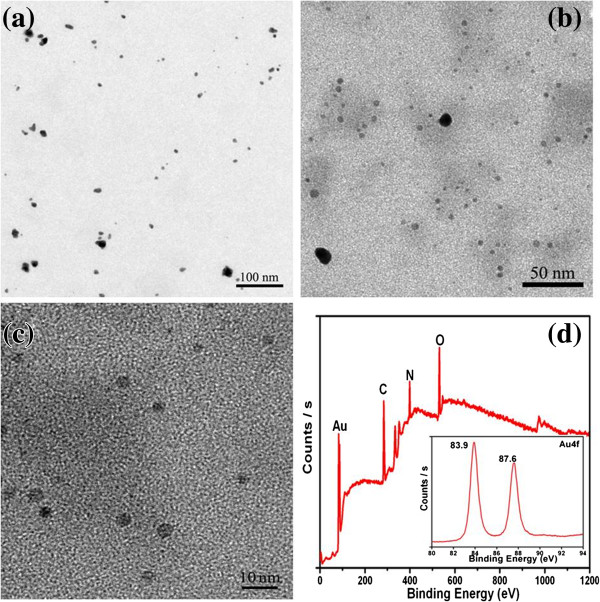
TEM images and XPS spectrum. (a, b, c) TEM images of BSA-Au nanocomplexes with different magnifications and (d) XPS spectrum of BSA-Au nanocomplexes; the inset is the XPS spectrum of the Au 4f band.

TEM images and XPS spectrum. (a, b, c) TEM images of BSA-Au nanocomplexes with different magnifications and (d) XPS spectrum of BSA-Au nanocomplexes; the inset is the XPS spectrum of the Au 4f band.