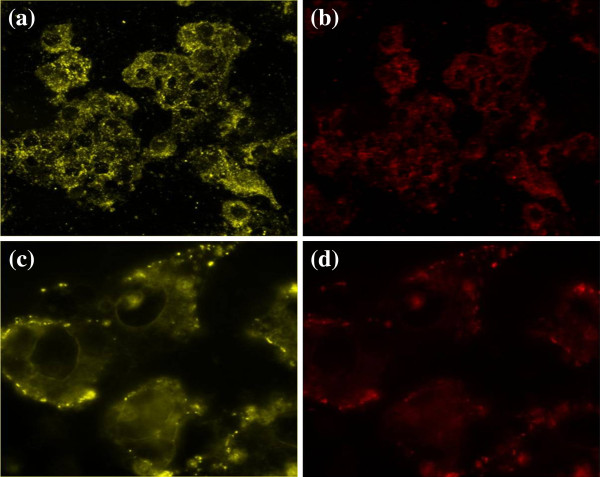
Figure 6.
Dark-field scattering images (a, c) and fluorescence images (b, d). (a, b) Low-magnification image of targeted MGC803 cells incubated with 50 μg/mL of BSA-Au nanocomplexes for 2 h. (c, d) High-magnification image of targeted MGC803 cells incubated with 50 μg/mL of BSA-Au nanocomplexes for 30 min, monitored by dark-field and fluorescence microscopy.

