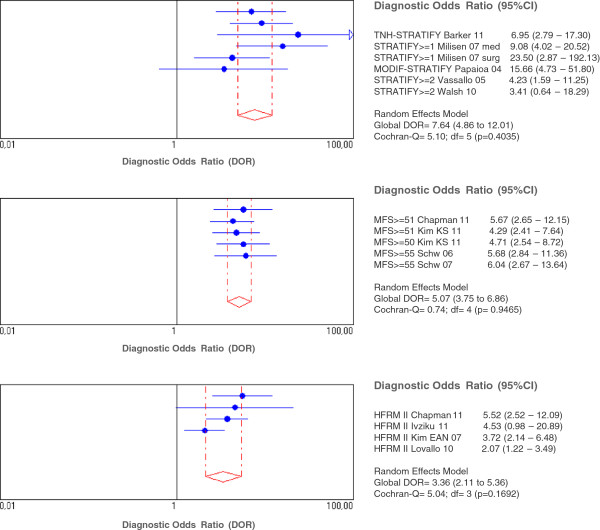
Figure 2.
Forest plots of diagnostic odds ratio of STRATIFY, MFS Y HFRM II tools. *Forest plot were DOR of each individual study is represented by the blue point and its correspondent 95% confidence intervals. The rhombus and the scattered red lines represent the global DOR and its 95% CI, respectively.

