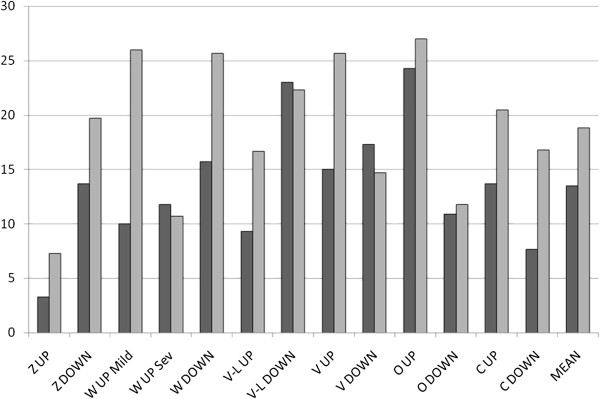
Figure 4.

Histogram showing percentages of genes in common among lists of differentially expressed genes from six microarray studies of CF related gene expression. Percentages are of number of regulated genes in one study regulated in the same direction (dark columns) or showing inverted expression (light columns) in the other five studies (Z: Zabner et al., 2005; W: Wright et al., 2006; V-L: Virella-Lowell et al., 2004; V: Verhaeghe et al., 2007; O: Ogilvie et al., 2011; C: current study). MEAN refers to mean percentage of all columns (data are summaries of percentages shown in Table 6).
