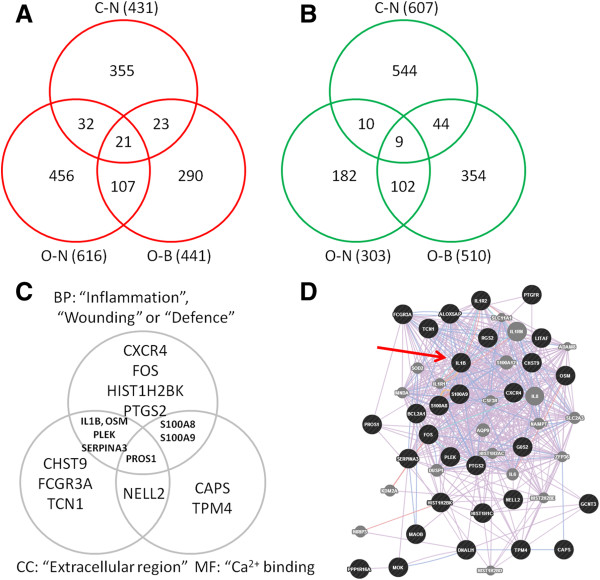
Figure 7.
CF gene signature in native airway tissues. Representations of a putative gene signature in native airway tissues. A) and B) Venn diagrams showing numbers of up-regulated (A), and down-regulated (B) genes shared between the present study (C-N: Clarke nasal) and the reanalyzed study [19] (O-N: Ogilvie nasal; O-B: Ogilvie bronchial [19] in F508del-CFTR expressing vs. control airway epithelial cells. Numbers in brackets refer to total number of genes in each list, and numbers at centre of each diagram refer to the 30 genes shared between all three lists (see Table 9). C) Venn diagram distribution of shared genes among the most significant GO terms for biological process (BP), cell compartment (CC) and molecular function (MF) as revealed by DAVID analysis. D) GeneMania network showing relationships between 30 shared genes (black circles) and other connecting genes (grey circles). Relationships are divided into co-expression (purple lines), co-localization (blue lines), pathway (light blue lines), physical interactions (pink lines) and predicted (orange lines). The red arrow indicates IL1B, which is the most connected gene involved with the highest number of identifiable functions including inflammation, defence, response to bacteria, and cytokine production.

