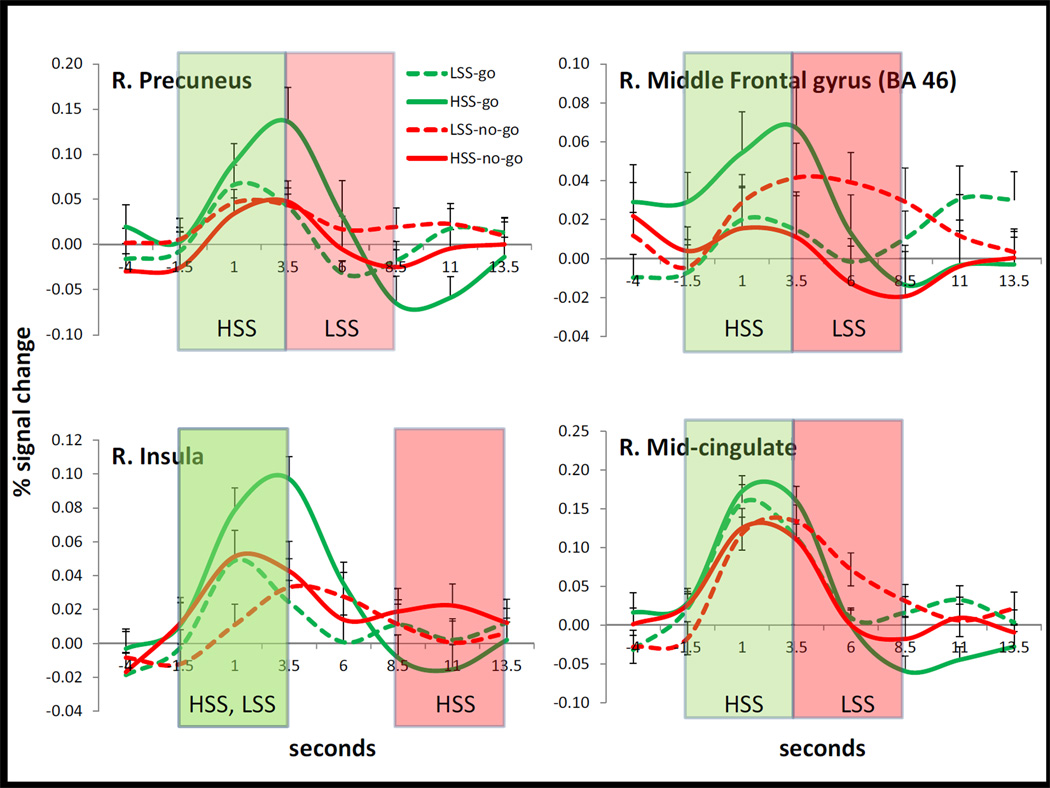
Figure 3.
Hemodynamic responses in four regions that showed a three-way interaction of sensation seeking, condition and time window. The x-axis, “Seconds”, indicates time relative to stimulus onset. The y-axis is percent signal change. Green overlays indicate time windows with a greater response to Go than to No-go trials in the group designated by the text (e.g., HSS, LSS). Red overlays indicate time windows with a greater response to No-go than to Go trials in the group designated by the text. Error bars are standard error of the mean.

