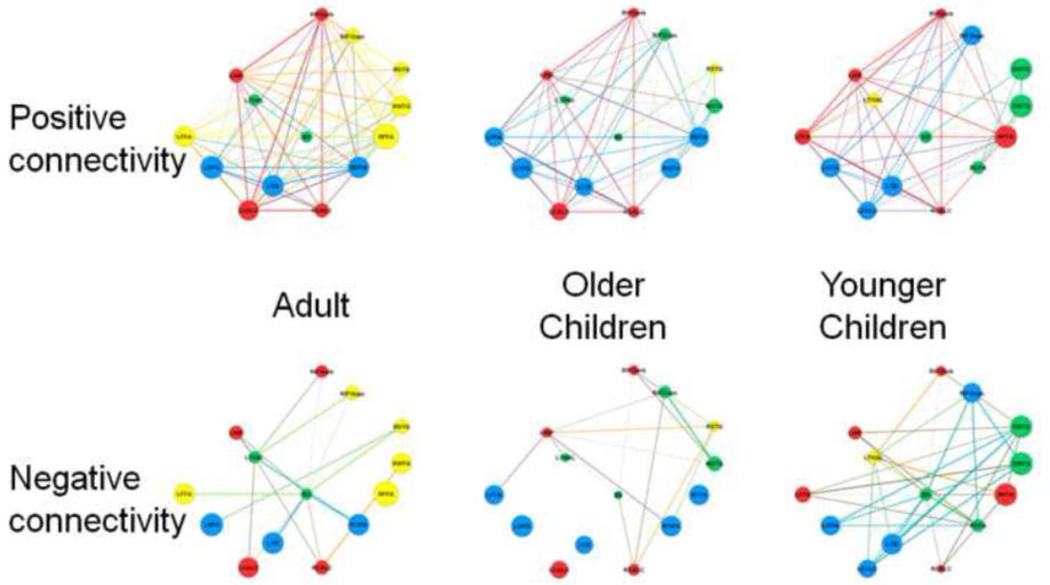
Figure 2.
Graphs of the positive and negative connectivity among regions of the typical adult face network at three ages: adults, older children and younger children. Colors represent the assignment of nodes to modules. Size of the nodes represents the strength of each node scaled to the maximum strength across all three age-specific networks. Node labels are described in Table 1.

