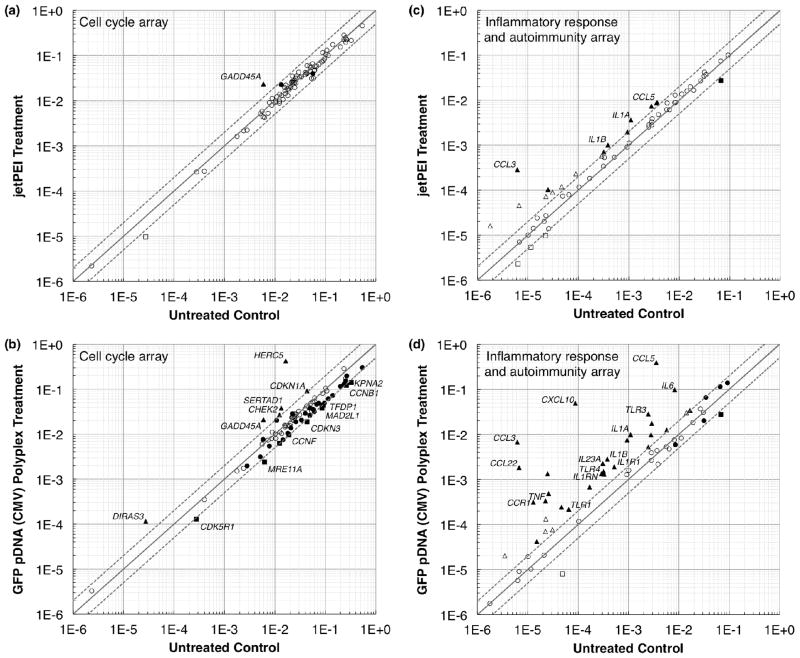
Figure 4.
Scatterplots showing the relative number of up- (▲) and downregulated (■) genes for the jetPEI™ and GFP pDNA (CMV) polyplex treatments compared to the untreated control at 24 h following transfection. (a) and (b) Cell cycle array. (c) and (d) Inflammatory response and autoimmunity array. The centerline indicates a fold change (2−ΔΔCt) of 1, and the upper and lower lines indicate fold changes of 2 in gene expression. Circles indicate fold changes ≤ 2. Comparing to the untreated control, filled symbols indicate regulation that is significantly different (p ≤ 0.05), and open symbols indicate regulation that is not significantly different. Only the significantly up- or downregulated genes shown in Tables 2 and 3 are labeled in this figure.

