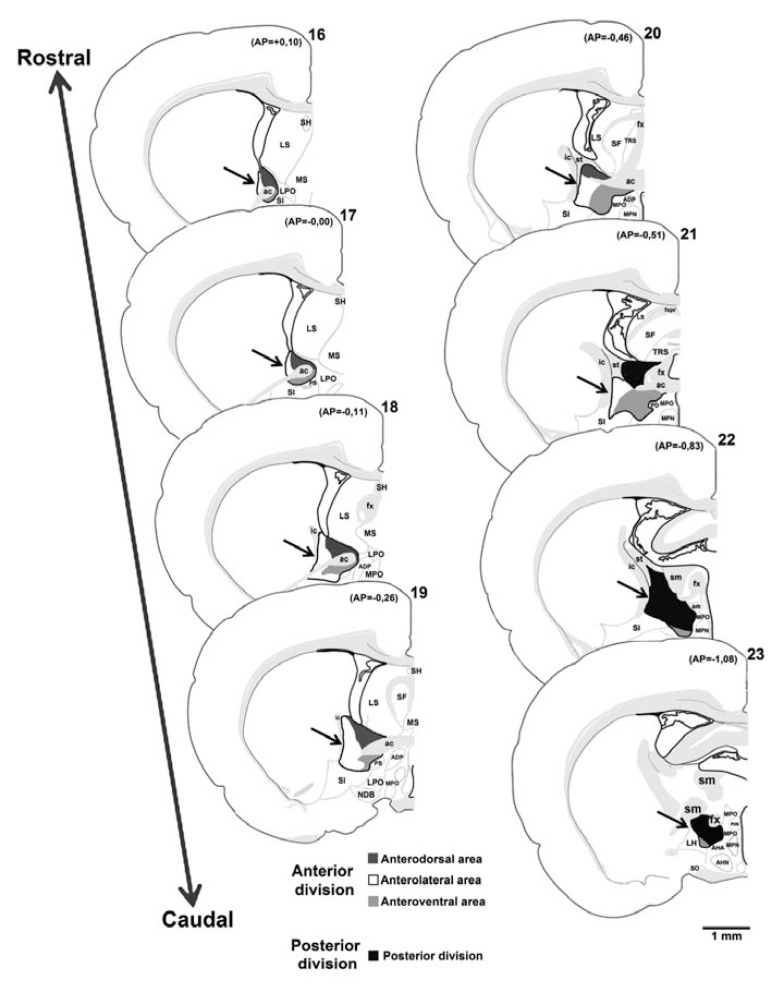
Fig. (1).
Schematic diagrams based on rat brain atlas of Swanson (2004) illustrating the BNST and its subregions. The atlas templates arranged from rostral (atlas level 16) to caudal (atlas level 23) level. The arrows indicate the BNST. The dark gray region show the anterodorsal area, the white region show the anterolateral area, the light gray region show the anteroventral area and the black region show the posterior division. ac, anterior commissure; ADP, anterodorsal preoptic nucleus; AHA, anterior hypothalamic area; AHN, anterior hypothalamic nucleus; am, amygdalar capsule; AP, antero-posterior (distance in mm from bregma); fx, fornix; ic, internal capsule; LH, lateral hypothalamic area; LPO, lateral preoptic area; LS, lateral septal nucleus; MPN, medial preoptic nucleus; MPO, medial preoptic area; MS, medial septal nucleus; NDB, diagonal band nucleus; PD, posterodorsal preoptic nucleus; PS, parastrial nucleus; PVH, paraventricular hypothalamic nucleus; SF, septofimbrial nucleus; SH, septohippocampal nucleus; SI, substance innominata; sm, stria medullaris; SO, supraoptic nucleus; st, stria terminalis; TRS, triangular nucleus septum.

