
Fig. 5.
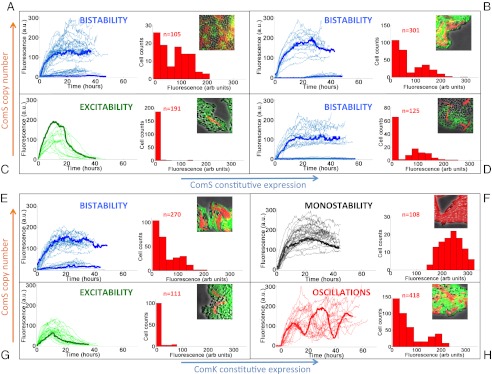
Dynamical phenotypes arising from input integration. The four upper panels correspond to joint variation of the ComS copy number (increasing vertically toward the right) and the ComS constitutive expression level (increasing horizontally toward the right): (A)  ,
,  ; (B)
; (B)  ,
,  ; (C)
; (C)  ,
,  ; and (D)
  ,
,  . The four lower panels correspond to joint variation of the ComS copy number (increasing vertically toward the right) and the ComK constitutive expression level (increasing horizontally toward the right): (E)
  ,
,  ; (F)
; (F)  ,
,  ; (G)
; (G)  ,
,  ; and (H)
  ,
,  . In each panel, the left plot shows a collection of single-cell time traces of CFP levels quantifying PcomG activity, and thus acting as ComK reporter. Color coding corresponds to the one used in Fig. 4, and a particular time trace is highlighted with a thicker line. The right plots show histograms of CFP levels as measured from a typical frame in each movie analyzed, and the Insets display selected snapshots from these movies.