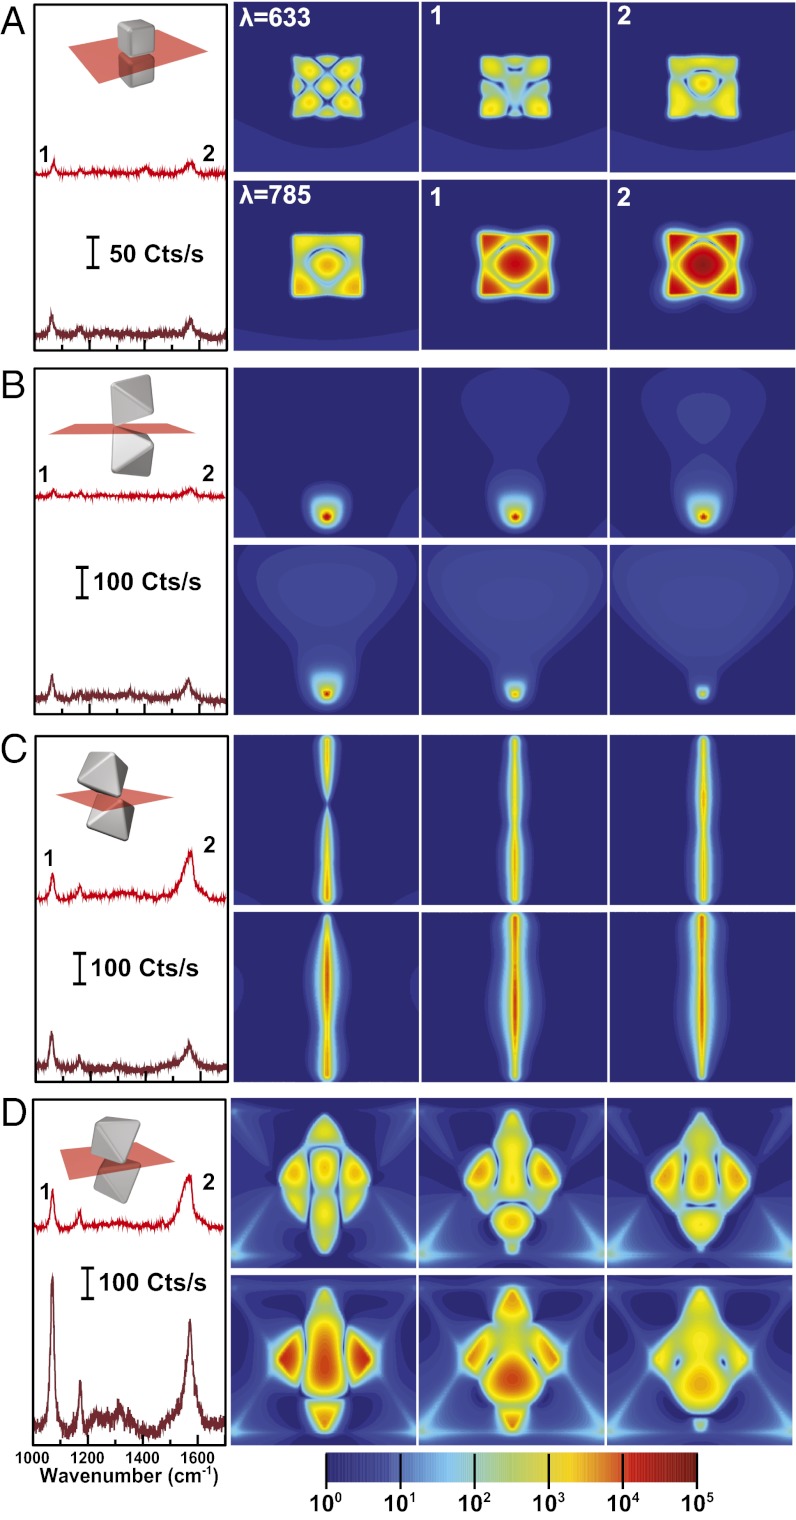
Fig. 3.
SERS properties and near-field enhancement of dimers at different excitation wavelengths. Representative SERS spectra of 4-AMT (Left) and near-field electric field intensity maps corresponding to the SERS excitation wavelengths (λ) and the specified Stokes modes (1, 2) of 4-AMT for the different dimers: (A) nanocube, (B) Octahedra T-T, (C) Octahedral E-E, and (D) Octahedral F-F. All near-field intensity maps use the same color bar below.

