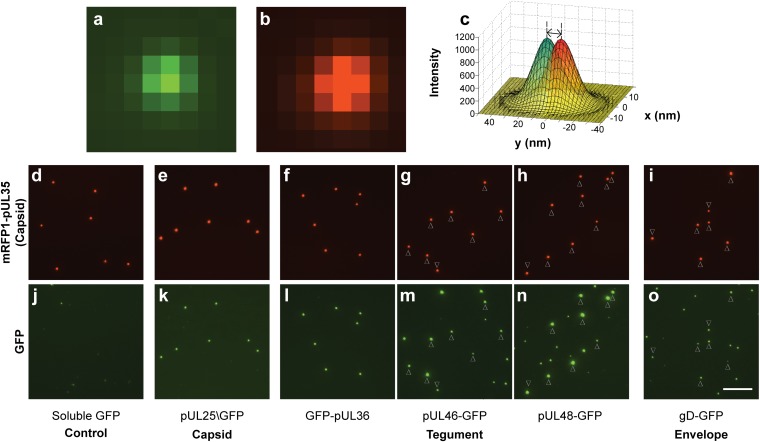
Fig. 1.
Acquisition of fluorescent proteins in to viral particles. (A and B) Fluorescence micrographs of a single diffraction-limited PRV particle expressing gD-GFP (A) and RFP-pUL35 (B). (C) Example of a red-green displacement measurement using simulated data: 2D Gaussian curves are shaded red and green, vertical dashed lines are the centroids, and the double-headed arrow is the measured displacement. (D–O) Micrographs of dual-fluorescent PRV particles. (D–I) mRFP1-pUL35 capsids. (J–O) corresponding GFP in matched fields. Where L-particles are abundant, arrowheads represent the position of H-particles. All exposures were 1.5 s. Images of the same color have equivalent intensity scaling. (Scale bar, 10 µm.)

