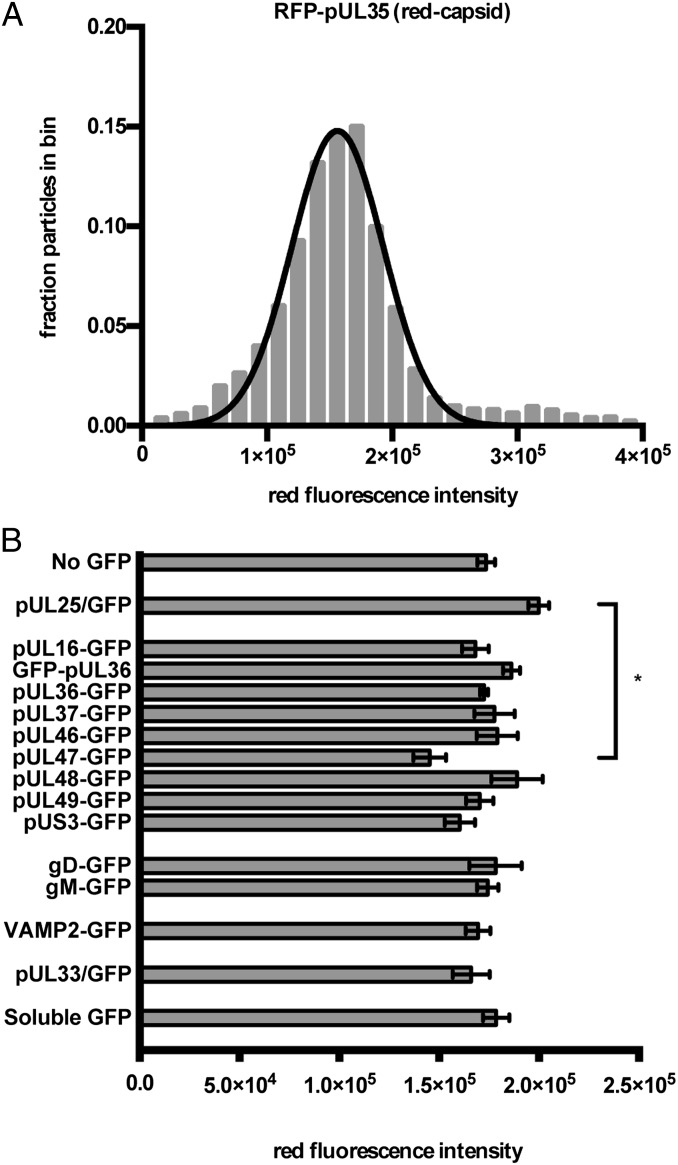
Fig. 2.
Capsid fluorescence properties of recombinant H-particles. (A) Representative frequency distribution of red capsid fluorescence. Red fluorescence intensity (x axis) is expressed in arbitrary units. Nonlinear regression was used to fit a normal distribution to the histogram. For all strains, the goodness of fit (R2) of the data to a normal distribution was greater than 0.95. (B) The average red fluorescence particle intensity for each recombinant virus. The x axis indicates intensity values expressed as arbitrary fluorescence units. Error bars represent the SEM for n ≥ 3 independent experiments. *P < 0.05, as determined by one-way ANOVA and a post hoc Tukey test.

