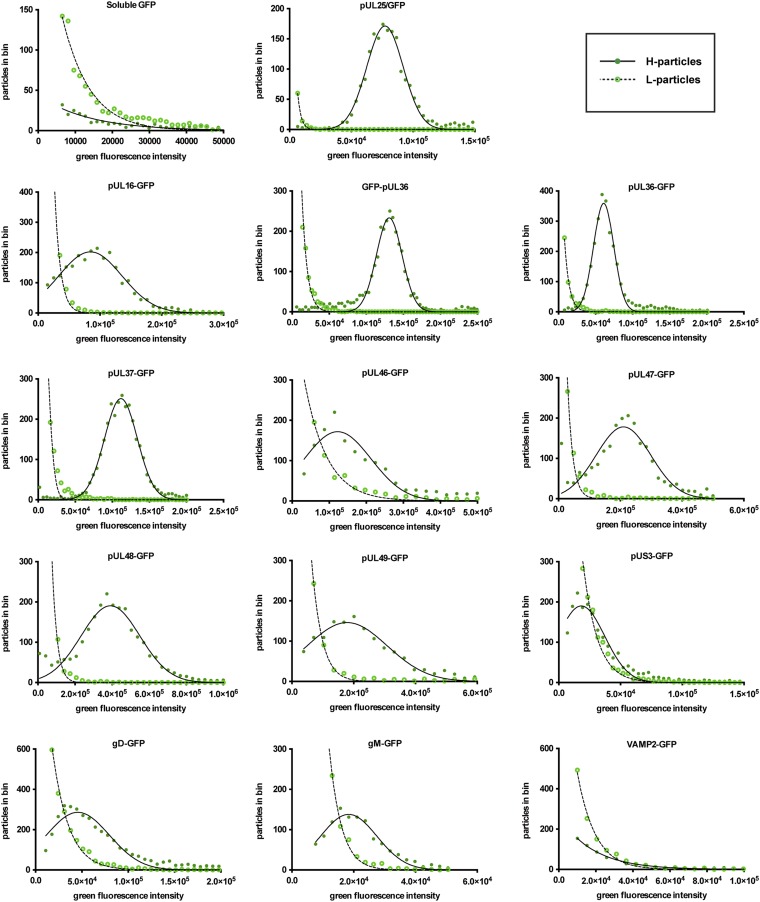
Fig. 4.
Comparison of L- and H-particle protein incorporation. The x axis indicates intensity values expressed as arbitrary fluorescence units. H-particle fluorescence (filled circles) was fit to a normal distribution (solid line), and L-particle fluorescence (empty circles) was fit to a decaying exponential distribution (dashed line). All L-particle decaying exponentials had a goodness of fit R2 > 0.98. Normal distributions fit H-particle data with R2 > 0.95, with the exception pUS3-GFP (R2 = 0.89), pUL46-GFP (R2 = 0.88), and UL47-GFP (R2 = 0.92), pUL48-GFP (R2 = 0.92), and gD-GFP (R2 = 0.93).

