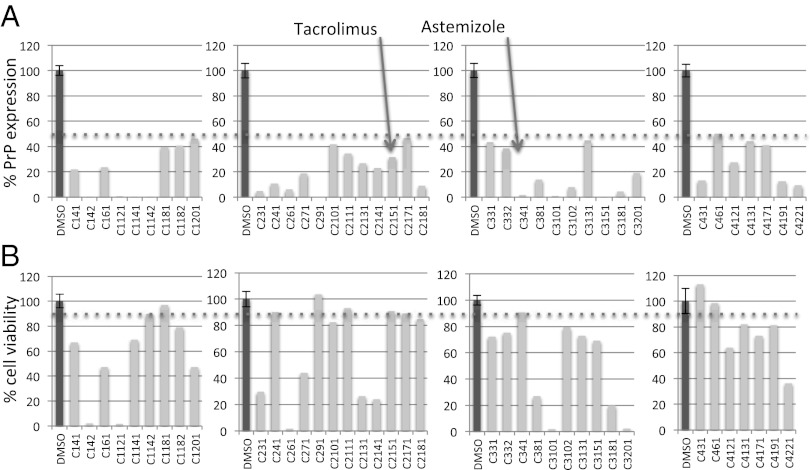
Fig. 1.
Candidate hits from PrP-FEHTA screen and counterscreen. (A) PrP expression levels as a percentage of the DMSO control measured by PrP-FEHTA. DMSO control is shown for each plate (plates shown as separate graphs). Brefeldine A (BFA) control reduced PrP to background in all plates. Z′ was 0.7 for all four plates. (B) Cell viability measured by CellTiter-Glo (counterscreen). Cutoffs (50% for PrP expression, ≤10% toxicity) are indicated by dotted lines. Surprisingly and interestingly, some drugs from this FDA-approved collection exhibited toxicity in vitro at 20 µM.

