
Fig. 2.
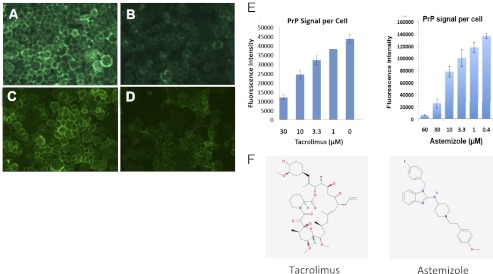
Hit validation by immunofluorescence on neuroblastoma cells and high-content analysis. N2a cells were treated with DMSO 0.5% (controls) or with the drug for 24 h. (A–D) PrP staining with D18 mAb on living cells, postfixation, and epifluorescence analysis. (A and C) Controls. (B) Tacrolimus, 20 µM. (D) Astemizole, 20 µM. (E) Quantitation of the dose–response to treatment by tacrolimus or astemizole using the high-content fluorescent imaging system InCell 1000. (F) Structures of tacrolimus and astemizole.