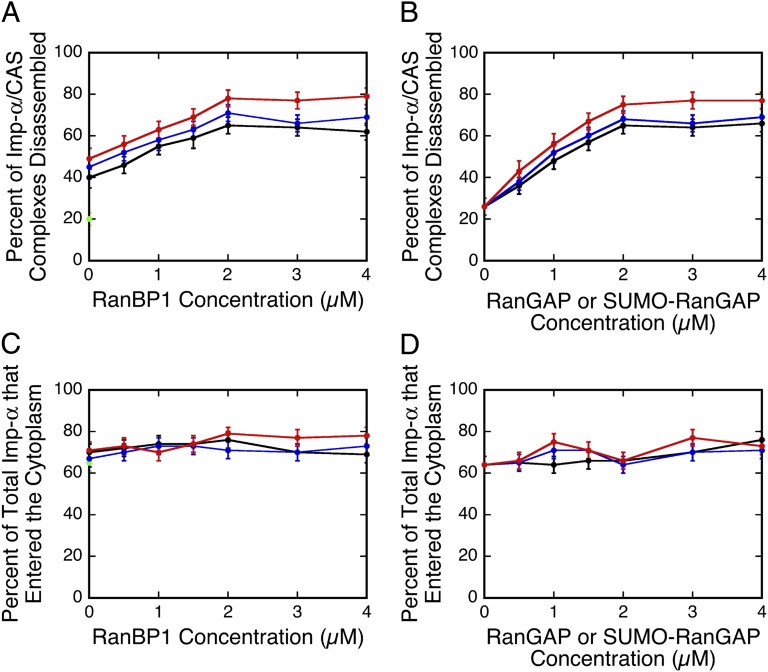
Fig. 8.
Imp-α/CAS complex disassembly efficiency and total transport of Imp-α. (A) Effect of RanBP1 on Imp-α/CAS disassembly efficiency in the presence of Ran GTPase-activating factors (n = 104–168; Table S2). Green, no addition; black, 3 µM RanGAP; blue, 3 µM SUMO1-RanGAP; red, 3 µM SUMO1-RanGAP + 5 µM Ubc9. (B) Imp-α/CAS disassembly efficiency in the presence of 3 µM RanBP1 and other Ran GTPase-activating factors (n = 116–151; Table S3). Black, RanGAP; blue, SUMO1-RanGAP; red, SUMO1-RanGAP + 5 µM Ubc9. (C and D) Total percentage of Imp-α (Imp-α + Imp-α/CAS complexes) released into the cytoplasm, according to the data in A and B, respectively, using the same coloring scheme. Conditions are the same as in Fig. 1D for A–D, unless otherwise indicated.

