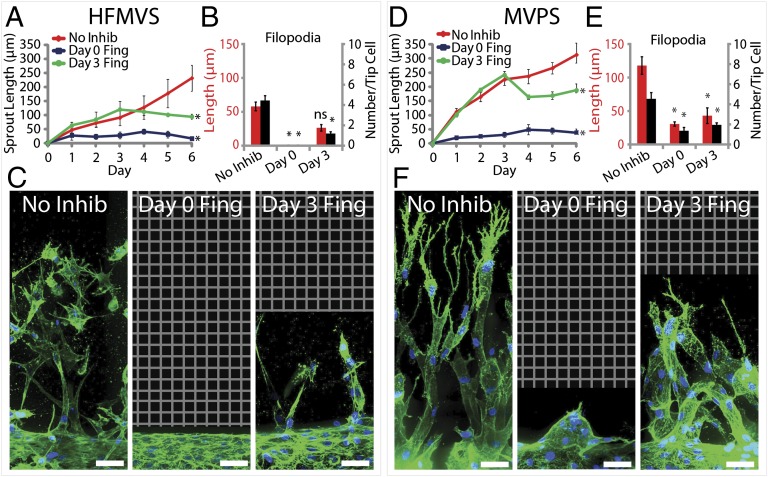
Fig. 4.
Effects of S1P receptor inhibition on angiogenic sprouting. (A and D) Plot of sprout length driven by HFMVS (A) or MVPS (D) in response to Fingolimod treatment over time. Proangiogenic cocktail was initiated at day 0 and Fingolimod treatment was initiated at either day 0 (Day 0 Fing), day 3 (Day 3 Fing), or never (No Inhib). (B and E) Quantification of filopodia length and number in sprouting for inhibitor treatment versus no-inhibitor control. (C and F) Representative confocal immunofluorescence images of indicated conditions at day 6. F-actin and nuclei are labeled with phalloidin (green) and DAPI (blue), respectively. Grid indicates no detectable signal, so no data were acquired. (Scale bars: 50 μm.) Error bars are SEM. *Significant difference from control (P < 0.05); ns, no significant difference from control. n = 5 samples for sprout length quantification and n = 3 samples for filopodia quantification. All filopodia quantifications performed on data from day 6 of the experiment.

