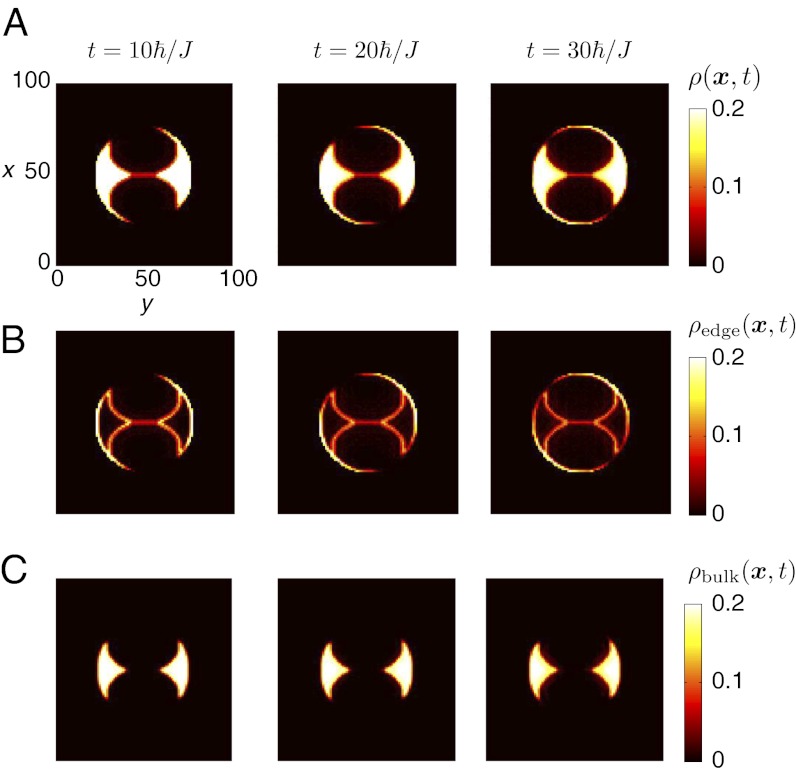
Fig. 4.
The topological quasi-flat band configuration. (A) The spatial density  , (B) the contribution of the initially populated edge states
  , and (C) the contribution of the initially populated bulk states
  . In all the figures,
  and
and  . The total number of particles is
  , whereas the number of initially populated edge states is
  . Note the dispersionless nature of the occupied bulk states, which highly improves the detection of the edge-state signal.

